Reading the H-1B Employer Data Hub
Use approval rates and initial filings to assess an employer's sponsorship track record.

The H-1B Employer Data Hub can help international job seekers decide which employers to ask for sponsorship. Its value depends on reading it correctly. Initial approvals, approval rates, and current labor filings together offer a better guide than total petition volume, which can make workforce maintenance look like new hiring.
What the H-1B Employer Data Hub is and what it was built to do
USCIS launched the hub on April 1, 2019, so the public could see the outcomes of H-1B petitions. It is the only free, official government source that lets candidates look up an employer’s approvals and denials before applying. Its records extend from fiscal year 2009 onward and draw on Form I-129 petitions and USCIS decisions independently of employer self-reporting.
The hub supports searches by fiscal year, employer name, city, state, ZIP code, and NAICS code, with annual and query-specific downloads in Excel or CSV. It identifies employers by the last four digits of their tax identification number. Binghamton University’s Fleishman Center presents it as a resource for international students checking prospective employers’ sponsorship histories. For someone facing a visa deadline, it replaces guesswork with a narrower, answerable question about whether an employer has sponsored successfully before.
How USCIS defines its fiscal year and why that shifts which data appears where
USCIS follows the federal fiscal year, which runs from October 1 through September 30. More importantly, the hub assigns a petition to the fiscal year in which USCIS adjudicated it. A petition filed in March but decided after September 30 therefore belongs to the following fiscal year.
An announcement from calendar year 2024 and an FY 2024 approval count may cover different windows. Pending cases do not appear, and quarterly updates may lag by one fiscal quarter, so the hub is not a live hiring feed. It also records only the first decision, excluding later outcomes such as appeals and revocations. Read each annual figure as a count of first decisions made during that period.
What each column in the hub actually measures — and what it does not
The hub separates approvals and denials into initial and continuing employment, drawing on six petition sub-types. New Employment covers beneficiaries outside the U.S. with no classification and people beginning work for a new or existing employer in a different nonimmigrant classification. Continuation of previously approved employment without change with the same employer covers workers who stay in the same classification without a change.
Change with Same Employer reports a non-material change, such as a new title without a material change in duties. New Concurrent Employment covers work for an additional employer while the beneficiary keeps the current job. Change of Employer covers a move to a new employer within the same nonimmigrant classification. Amended Petition reports a material change in employment or training terms or beneficiary eligibility, or requests H-2A or H-2B substitutions.
For analysis, Initial combines New Employment and New Concurrent Employment, while Continuing covers extensions, amendments, and transfers. This grouping means that an outside hire transferring from another employer can appear under Continuing. Neither column is a literal census of people newly hired by the company. They are petition categories, and that distinction limits what they can prove.
The rows also need interpretation because counts are grouped by fiscal year, two-digit NAICS code, tax ID, state, city, and ZIP code. An employer with more than one address can have more than one row. USCIS uses the most common spelling of an employer’s name for each unique tax ID, while subsidiaries with different EINs are listed as separate filers.
Geography has a separate trap. State and City reflect the petitioner’s mailing address, which may differ from the worker’s location. A firm headquartered in New Jersey that places workers at client sites in Texas appears under New Jersey. The hub also omits wages, detailed job information beyond classification, denial reasons, RFE detail, and a key connecting petitions to specific LCAs.
Why initial approvals are the number that matters most to an outside candidate
For candidates seeking new sponsorship, initial approvals are the most useful first filter. A high continuing count may mostly show that employers are extending arrangements for people they already sponsor. That work shows that an employer has a way to handle sponsorship, but says much less about the chances for someone seeking it for the first time. Transfers complicate the boundary, yet they do not make total approvals a better measure of new sponsorship.
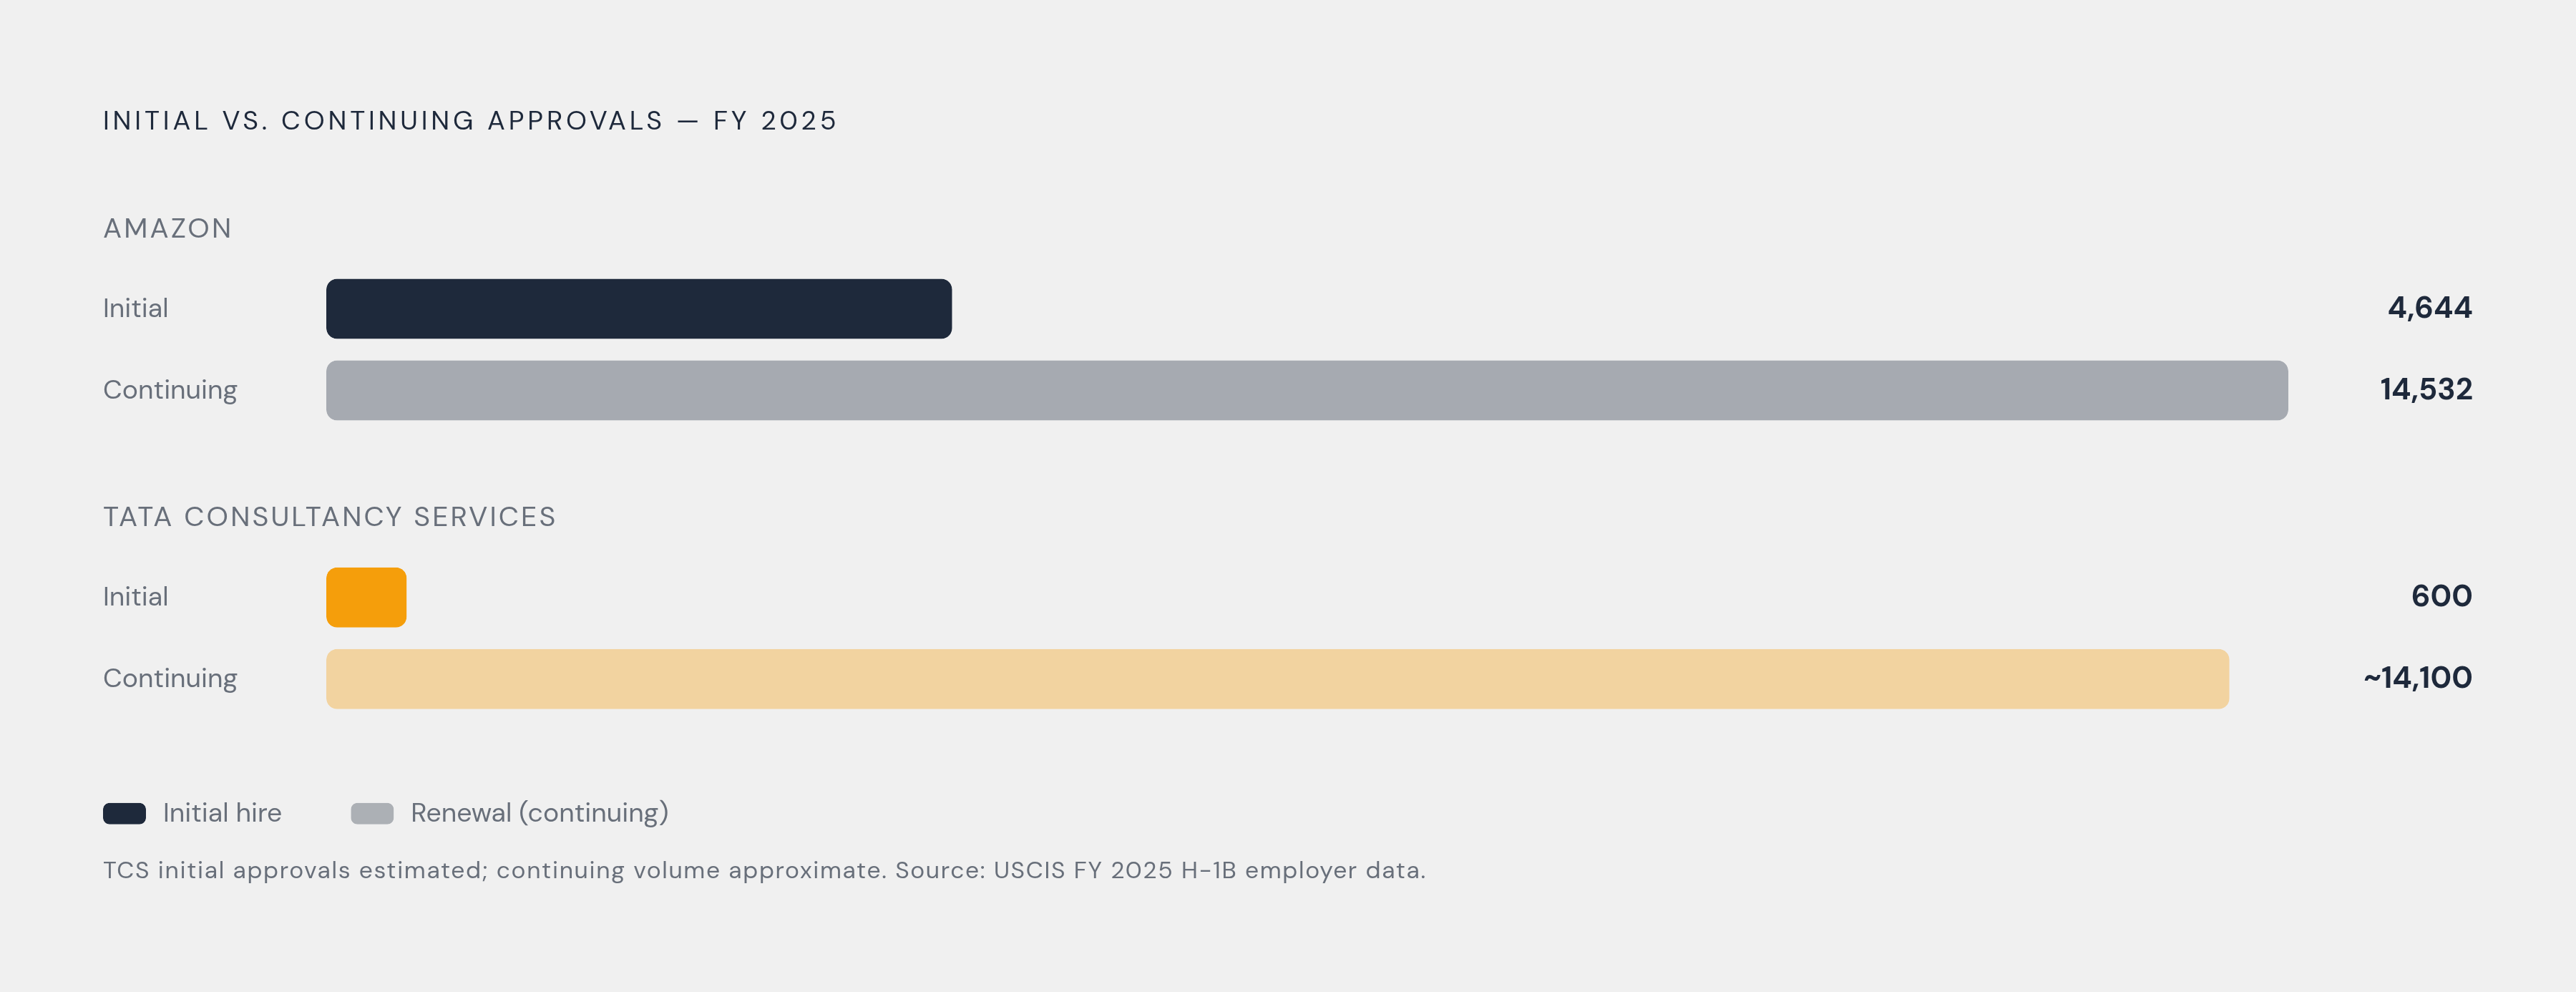
NFAP’s analysis of USCIS data illustrates the distinction in FY 2025. Amazon led continuing employment approvals with 14,532, while TCS had far fewer continuing approvals and a sharp year-over-year fall in initial approvals. Reading only total volume would obscure that difference between new sponsorship and renewal of an existing workforce. The practical response is to sort by initial approvals rather than total approvals, without treating the result as a judgment about employer quality.
How approval rates reveal which employers file strong petitions and which ones don't
Volume shows how much an employer sponsors, while the approval rate shows how often its petitions succeed. Calculate the rate by dividing approvals by approvals plus denials, using initial counts for an initial-employment comparison. A large numerator can look impressive until the denominator arrives. Reading both gives a better signal of how reliably an employer’s filings withstand USCIS scrutiny.
Business models help explain why rates differ. IT staffing and consulting firms that place workers at third-party client sites tend to face closer checks of the employer-employee relationship and have lower approval rates. An elevated initial denial rate can reflect weak cases, a stretched specialty occupation argument, or a model that draws closer examination. The hub cannot distinguish among those explanations, so the rate offers only a limited signal.
NFAP’s analysis put the FY 2025 continuing-employment denial rate at just 1.9%, underscoring why renewals should not be mixed into an assessment of initial filing outcomes. Initial approval rates well above the majority mark offer a safer broad signal, but that is only a loose screen. The more useful shortlist test is whether an employer falls noticeably below the high-nineties norm for direct employers. Such a result calls for investigation of the business model before applying or drawing a conclusion about the company.
What the hub cannot answer and which data sources fill those gaps
The USCIS hub supplies an employer’s adjudication record. The DOL Office of Foreign Labor Certification’s LCA disclosure files supply role, pay, and worksite information and evidence of sponsorship intent. BLS Occupational Employment Statistics data supplies prevailing wage baselines for roles and locations. Together, the three sources connect sponsorship outcomes with the kind of work and compensation a candidate is actually seeking.
DOL LCA disclosure files include employer name and FEIN, SOC code, job title, wage level I–IV, offered wage, and worksite geography. Those fields let candidates check whether an employer’s filings match the work, location, and pay they want. An LCA is evidence of sponsorship intent and a useful wage benchmark, with the hiring of a particular person remaining unconfirmed. BLS OES data then helps distinguish an offer near the wage floor from one well above it.
The datasets do not publish a unique key linking an individual LCA to an individual USCIS petition. Combining them therefore supports analysis at a directional level only. PERM data should not take the place of H-1B wage benchmarking because permanent labor certification uses a different standard of evidence and can show higher wages than an H-1B LCA. Both programs draw on the same OEWS-based prevailing wage methodology, but their records are not interchangeable.
A step-by-step method for turning a hub query into a shortlist of employers worth approaching
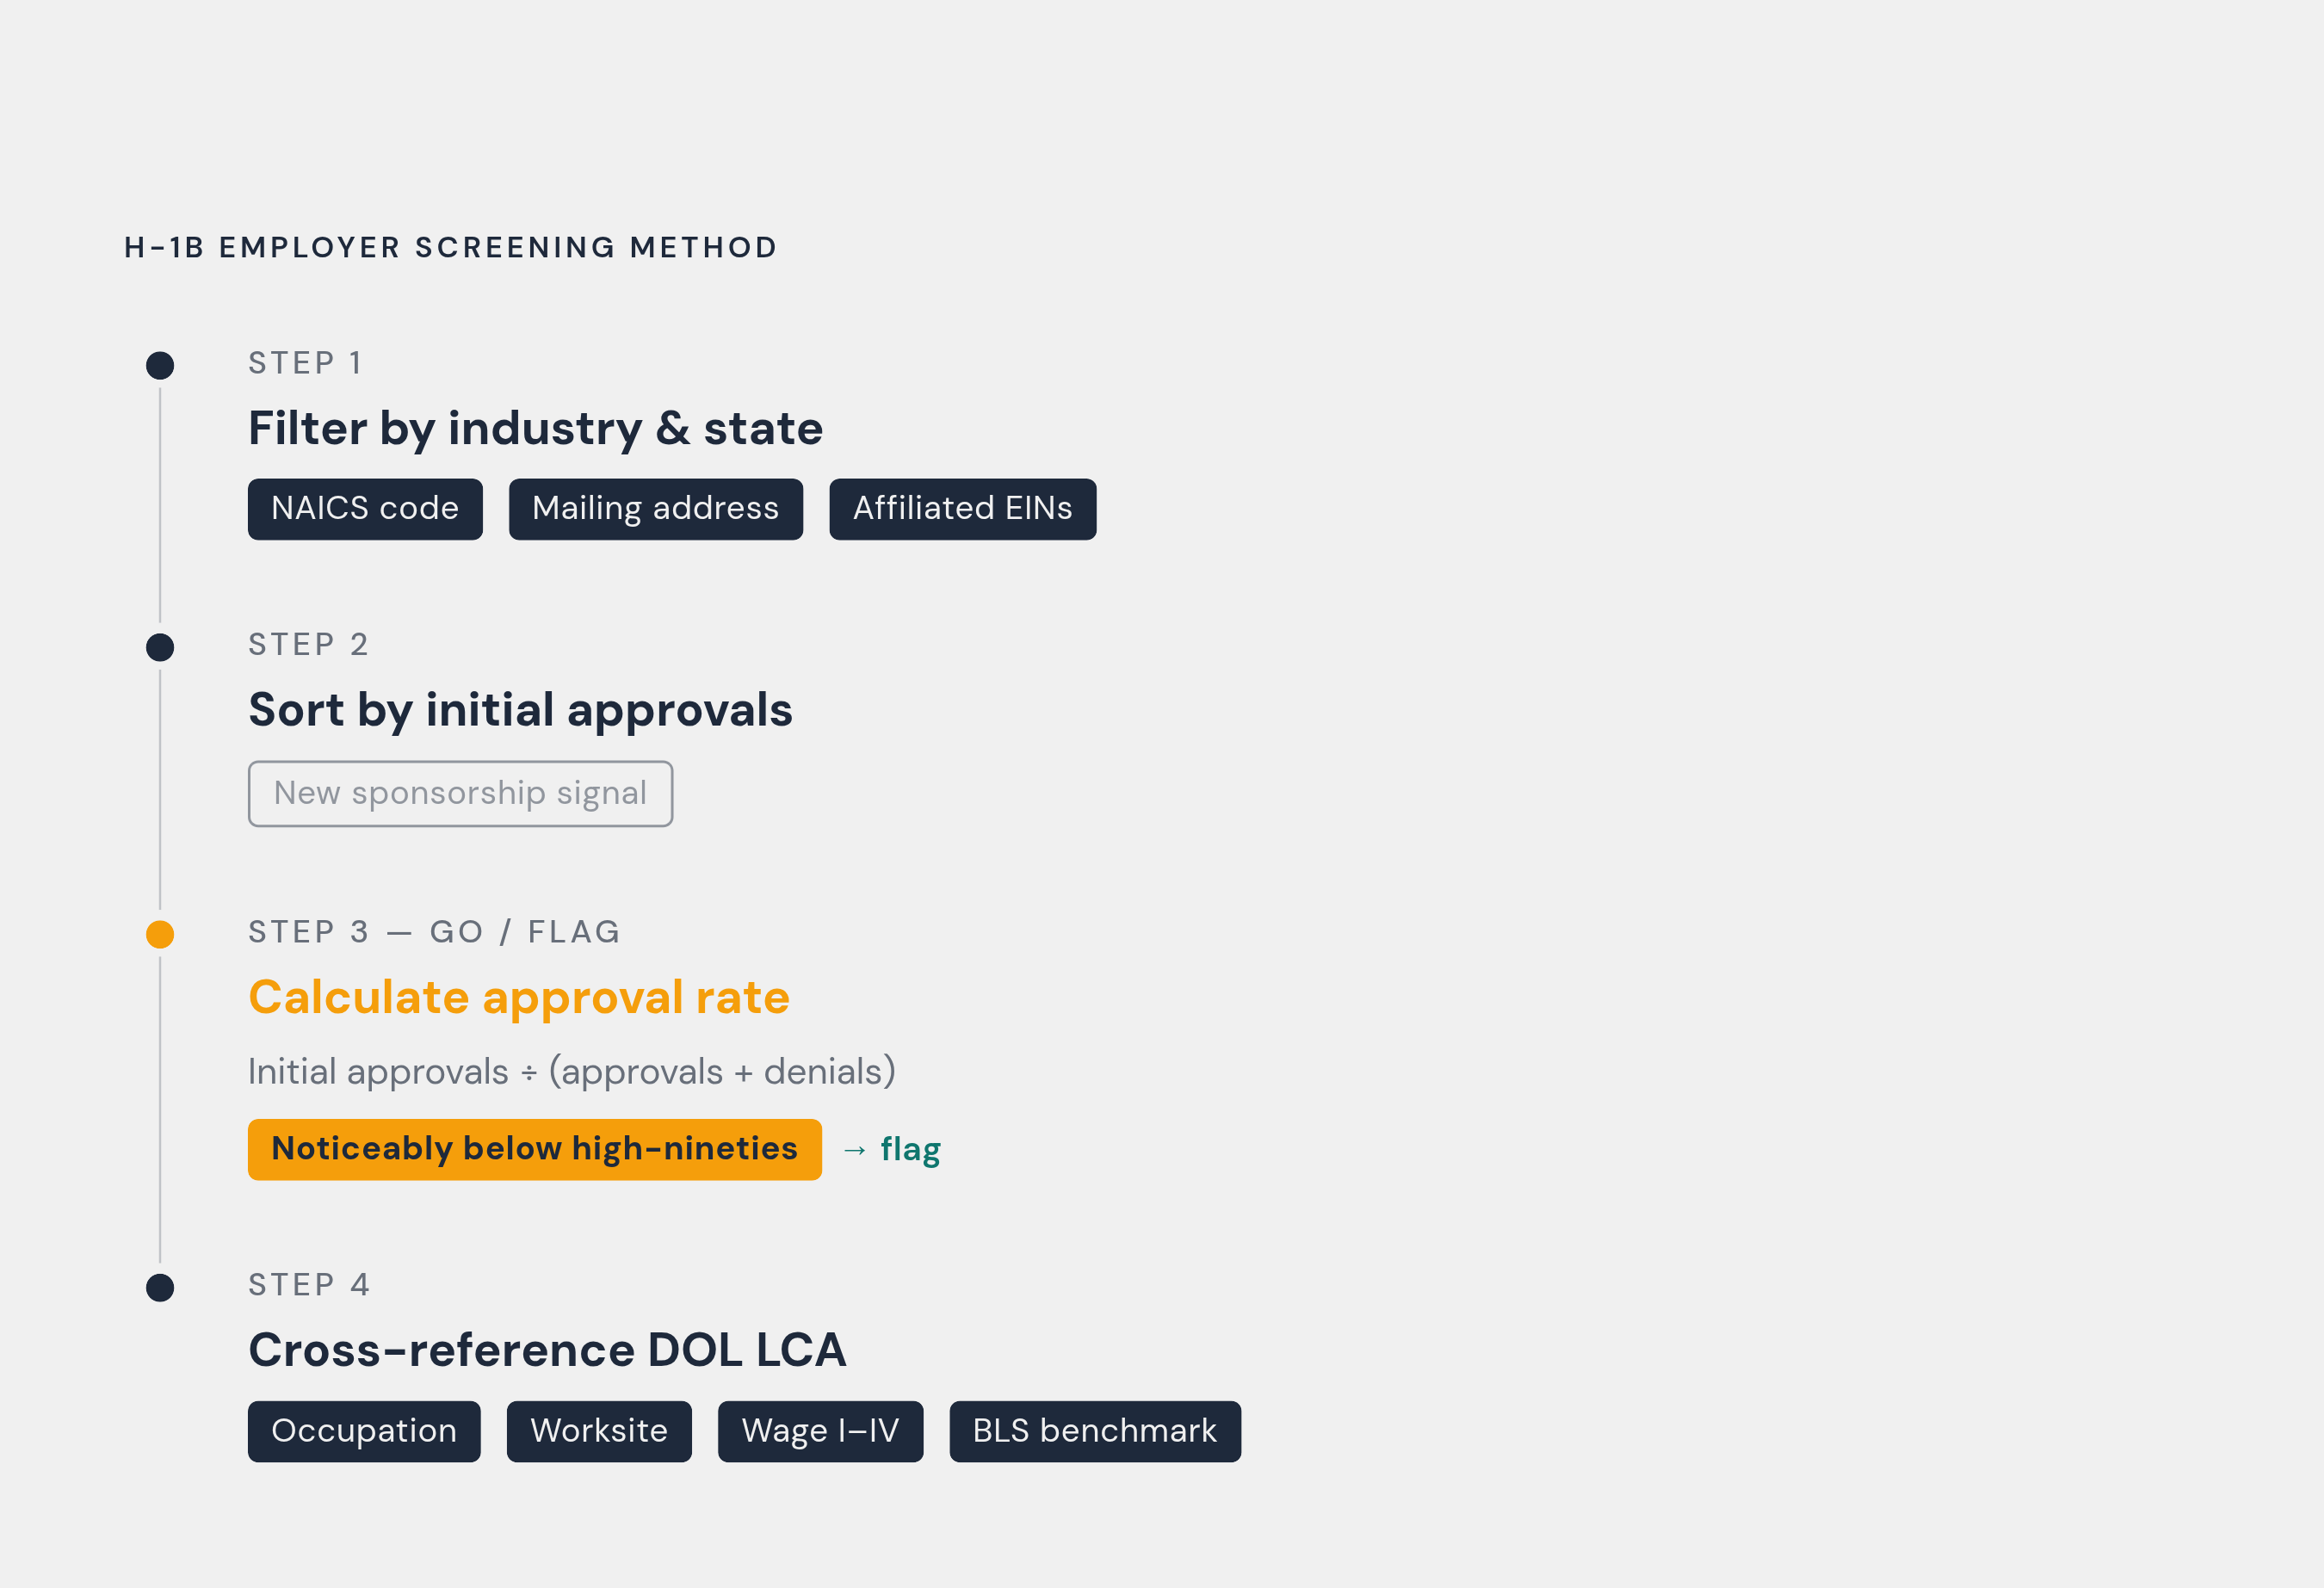
Step 1 is to filter by industry and geography. Use the NAICS industry filter and state to narrow the search to employers filing in the relevant sector and region. The geography is an initial screen based on mailing addresses, with actual worksites established later. When a parent company’s record looks small, include affiliated entities in the search because separate EINs divide the corporate picture.
Step 2 is to sort the results by initial approvals. This puts employers with stronger evidence of new sponsorship ahead of those whose totals depend mainly on continuing petitions.
Step 3 is to work out each employer’s initial approval rate. Divide initial approvals by initial approvals plus initial denials to place the count in context. Flag results noticeably below the high-nineties norm for direct employers for investigation of the business model.
Step 4 is to cross-reference the remaining employers with current DOL LCA data. Look for filings matching the occupation and actual worksite, and compare wage levels and offered pay with salary expectations and the BLS benchmark. An employer filing only Level I LCAs for the relevant role may not be targeting the seniority sought.
Treat the result as a prioritized starting point, with any employer’s commitment still to be established. Sponsorship history is the best available predictor of future sponsorship, but hiring plans change from year to year.
What FY 2025 data shows when the method is applied to real employers
NFAP’s analysis of USCIS data placed Amazon first for FY 2025 initial employment approvals with 4,644, followed by Meta Platforms, Microsoft, and Google. For the first time, those four U.S. technology companies occupied the top four positions for new H-1B approvals.
The continuing-employment order makes that contrast visible. Amazon still led, but TCS, Microsoft, Meta, Apple, and Google followed. TCS’s continuing volume far exceeded its initial approvals, placing it prominently in workforce maintenance without the same prominence in new sponsorship. Separating the columns exposes that multi-year decline otherwise concealed by renewal activity.
At this point in the cycle, the initial counts pointed toward direct-employer technology companies as more active new sponsors than large IT services firms. They did not, by themselves, establish which employer matched a candidate’s occupation, pay expectations, or work location. Those questions still require the rate and LCA stages of the method. FY 2025 is a snapshot, so the analysis should be rerun against current data rather than preserved as a permanent employer ranking.
The current state of the hub and what to do when the data is incomplete or missing
The hub’s latest availability failures go beyond a routine reporting lag. In early August 2026, FY 2024 through FY 2026 data were missing from the hub, its search function and interactive map were unavailable, and its download page no longer listed those years. Pages were relabeled as “Archived Content”. The USCIS hub page’s latest available description still referred to coverage through FY 2026, quarter 3. That stated coverage did not establish that the underlying records remained accessible.
FY 2023 and earlier records can establish a multi-year track record, and consistent sponsorship across five or more prior fiscal years is stronger evidence than no history. Current DOL LCA disclosure data provides an independent indication of active sponsorship plans. Together, those sources show what an employer has done and what it now plans to do, though neither proves it will hire someone.
Platforms that preserve multi-year sponsorship records can also provide continuity when the official source becomes unavailable. The three-source approach is therefore both an analytical method and protection against missing data.